 UK Schools
Wellfield School
Wellfield School is a mixed secondary academy in Wingate, Durham County Council, teaching 862 pupils aged 11 to 16. In 2024–2025, GCSE Attainment 8 was 47.8 (England 46.1). Its 2025–2026 calendar lists 14 holidays and 4 INSET days.
Term dates & holidays 2025–2026
Autumn, spring and summer terms, half-terms, INSET days and bank holidays for Wellfield School.
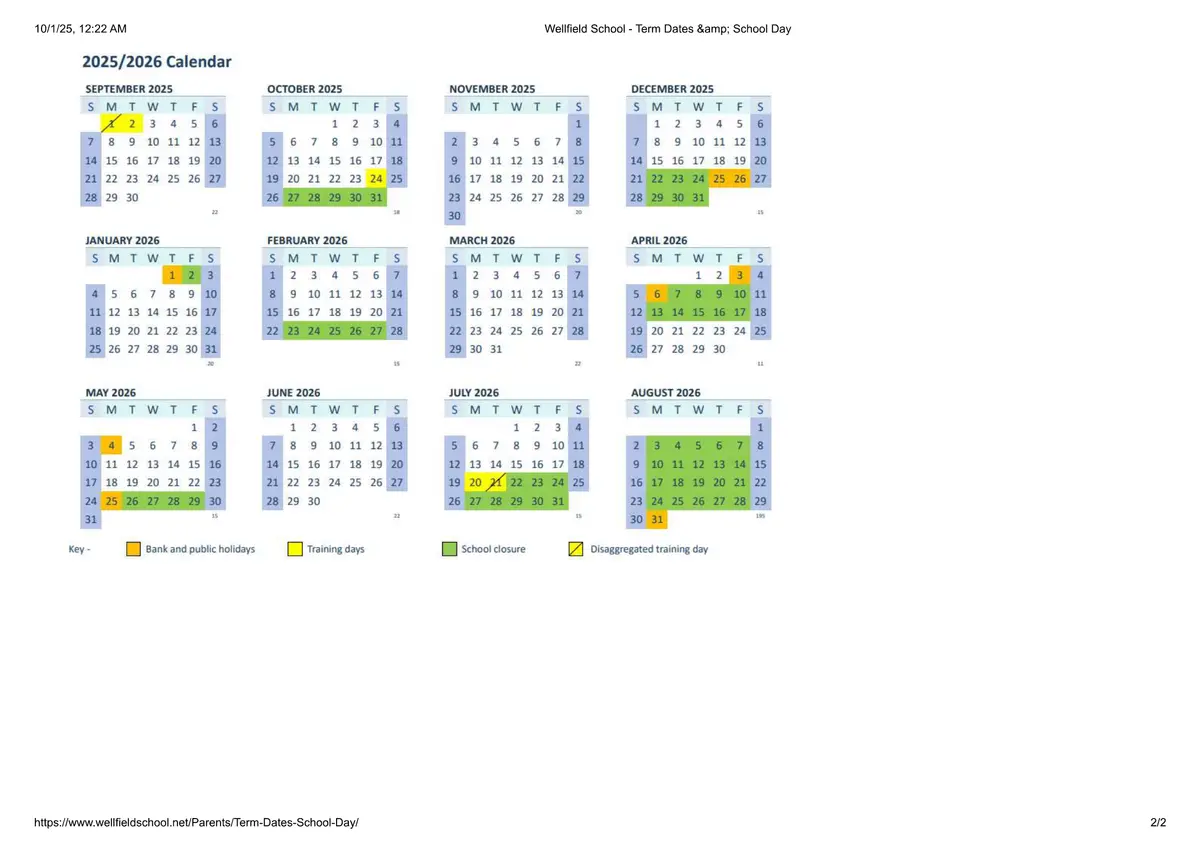
- 1 Disaggregated Training Day
- 2 First Day of School
- 2 Training Day
- 27–31 Autumn Half Term Holiday
- 22–31 Christmas Holiday
- 23 Training Day
- 25 Christmas Day (Bank Holiday)
- 26 Boxing Day (Bank Holiday)
- 1–2 Christmas Holiday
- 1 New Year's Day (Bank Holiday)
- 23–27 Spring Half Term Holiday
- 3 Good Friday (Bank Holiday)
- 6–17 Easter Holiday
- 6 Easter Monday (Bank Holiday)
- 4 Early May Bank Holiday
- 25–29 Summer Half Term Holiday
- 25 Spring Bank Holiday
- 20–31 Summer Holiday
- 20 Training Day
- 1–31 Summer Holiday
- 31 Summer Bank Holiday
Key dates (2025–2026)
- First Day of School Sep 2, 2025 Event
- Autumn Half Term Holiday Oct 27-31, 2025 Holiday
- Christmas Holiday Dec 22, 2025 - Jan 2, 2026 Holiday
- Spring Half Term Holiday Feb 23-27, 2026 Holiday
- Easter Holiday Apr 6-17, 2026 Holiday
- Summer Half Term Holiday May 25-29, 2026 Holiday
- Summer Holiday Jul 20 - Aug 31, 2026 Holiday
- Training Day Sep 2, 2025 Inset Day
- Training Day Dec 23, 2025 Inset Day
- Training Day Jul 20, 2026 Inset Day
- Disaggregated Training Day Sep 1, 2025 Inset Day
- New Year's Day (Bank Holiday) Jan 1, 2026 Holiday
- Good Friday (Bank Holiday) Apr 3, 2026 Holiday
- Easter Monday (Bank Holiday) Apr 6, 2026 Holiday
- Early May Bank Holiday May 4, 2026 Holiday
- Spring Bank Holiday May 25, 2026 Holiday
- Summer Bank Holiday Aug 31, 2026 Holiday
- Christmas Day (Bank Holiday) Dec 25, 2025 Holiday
- Boxing Day (Bank Holiday) Dec 26, 2025 Holiday
Exam results & performance
The measures that carry the most signal. Open a section to compare Wellfield School with Durham County Council and England.
Key stage 4 (GCSE) 47.8 Attainment 8 score
Year 11 results across eight qualifications, including English and maths.
This school Durham County Council England
Attendance 28.3% Persistently absent pupils
Absence across the whole school year.
This school Durham County Council England
What pupils do after GCSEs 84% In education, apprenticeship or work
Still in education, an apprenticeship or work a year after key stage 4.
This school Durham County Council England
About this data source & caveats
Progress 8 is not published for 2024–2025. This year group missed their key stage 2 tests in 2020, so there is no baseline to measure progress from.
Attendance comparisons are pupil-weighted averages we calculate from every school’s published absence figure — the DfE absence file has no local authority or England rows of its own.
We show the headline measures only. Threshold and curriculum-policy figures — grade 4+ in English and maths, EBacc entry and points, the per-subject key stage 2 breakdown, academic and applied splits at 16 to 18 — reflect admissions and curriculum choices more than school quality, so they are left to GOV.UK. Progress measures matter most because they compare pupils with others who started at the same level; attainment on its own largely tracks a school’s intake.
Figures are the Department for Education’s official published results for Wellfield School. Results are suppressed where too few pupils were entered. England figures are the average for state-funded schools. “Top x%” is this school’s position among all schools in England with a published figure for that measure — the DfE does not publish league table rankings.
Source: Compare school and college performance, Department for Education. Contains public sector information licensed under the Open Government Licence v3.0.
Location & catchment area
Indicative only. This is a nearest-school (Voronoi) estimate — the area closer to Wellfield School than to any other secondary school. Real admissions depend on the school’s own policy (straight-line distance, siblings, faith, feeder schools and available places) and change each year. Always confirm with the school and local authority admissions team.